

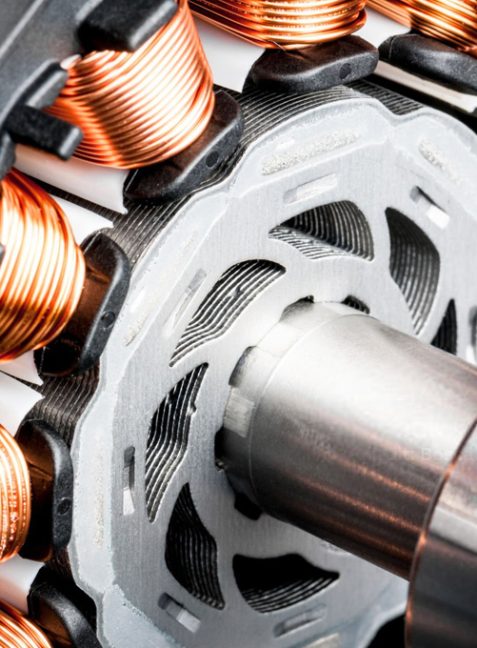
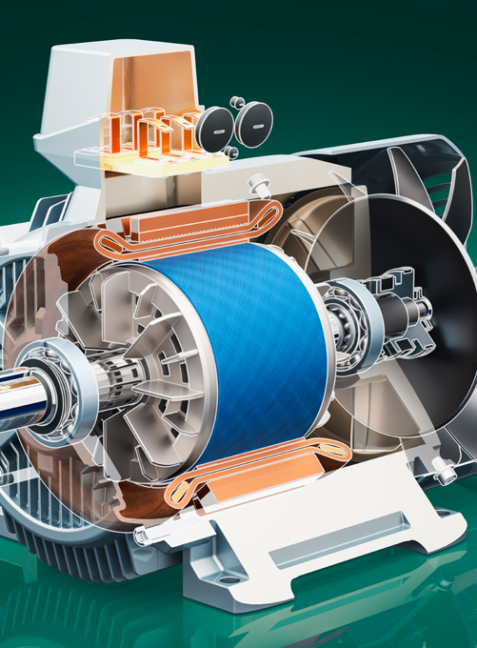
Motors
Design, Development and Prototyping of Brushless PM Motors
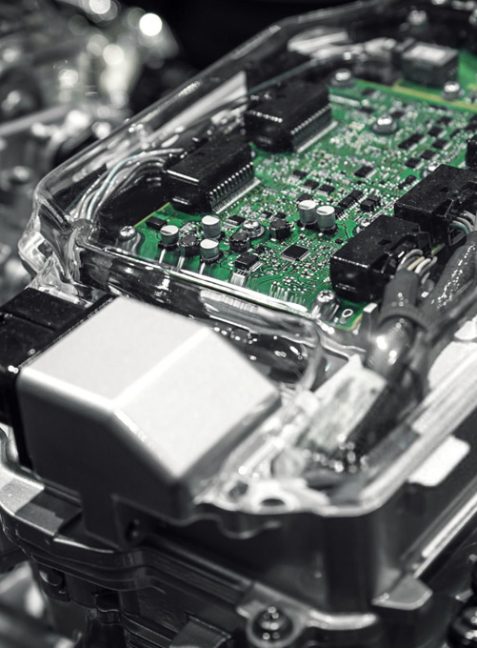
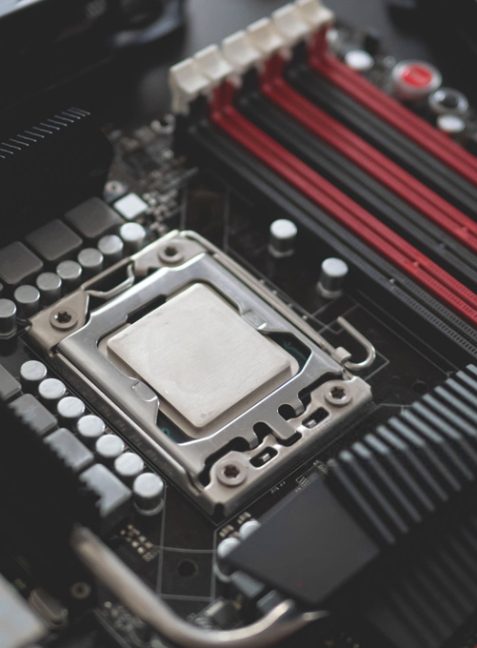
Circuit Design
Switch Mode Power Supplies, High Frequency Electromagnetics, PCB Layout
Drives
50W to 500kW Design, Development and Prototyping of Drives

Project Management
BLITZDEVS TM
Lighting Speed Product Development
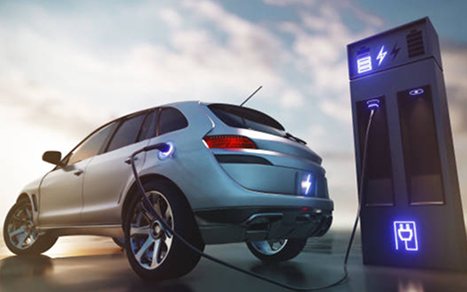
Electric Vehicles & Components
Motors, Drives, Batteries and Chargers
Simulations
Matlab, Pspice, LTSpice, Finite Element Analysis (FEA using FEMM, Simcenter Motor Solve and Ansys Motor CAD)

Power Up Your Knowledge. Elevate Your Innovation.

Inverter, Hardware & Firmware Design
Finite Element Analysis & System Optimization